Key Features

Comprehensive Data Integration
Our BI dashboards seamlessly integrate data from various sources, including sales data, labor data, and other key performance indicators (KPIs). We connect with third-party APIs such as labor APIs and marketing APIs to ensure you have a holistic view of your business operations. Additionally, we can integrate different billing systems to fetch sales data and connect various procurement channels for raw data.
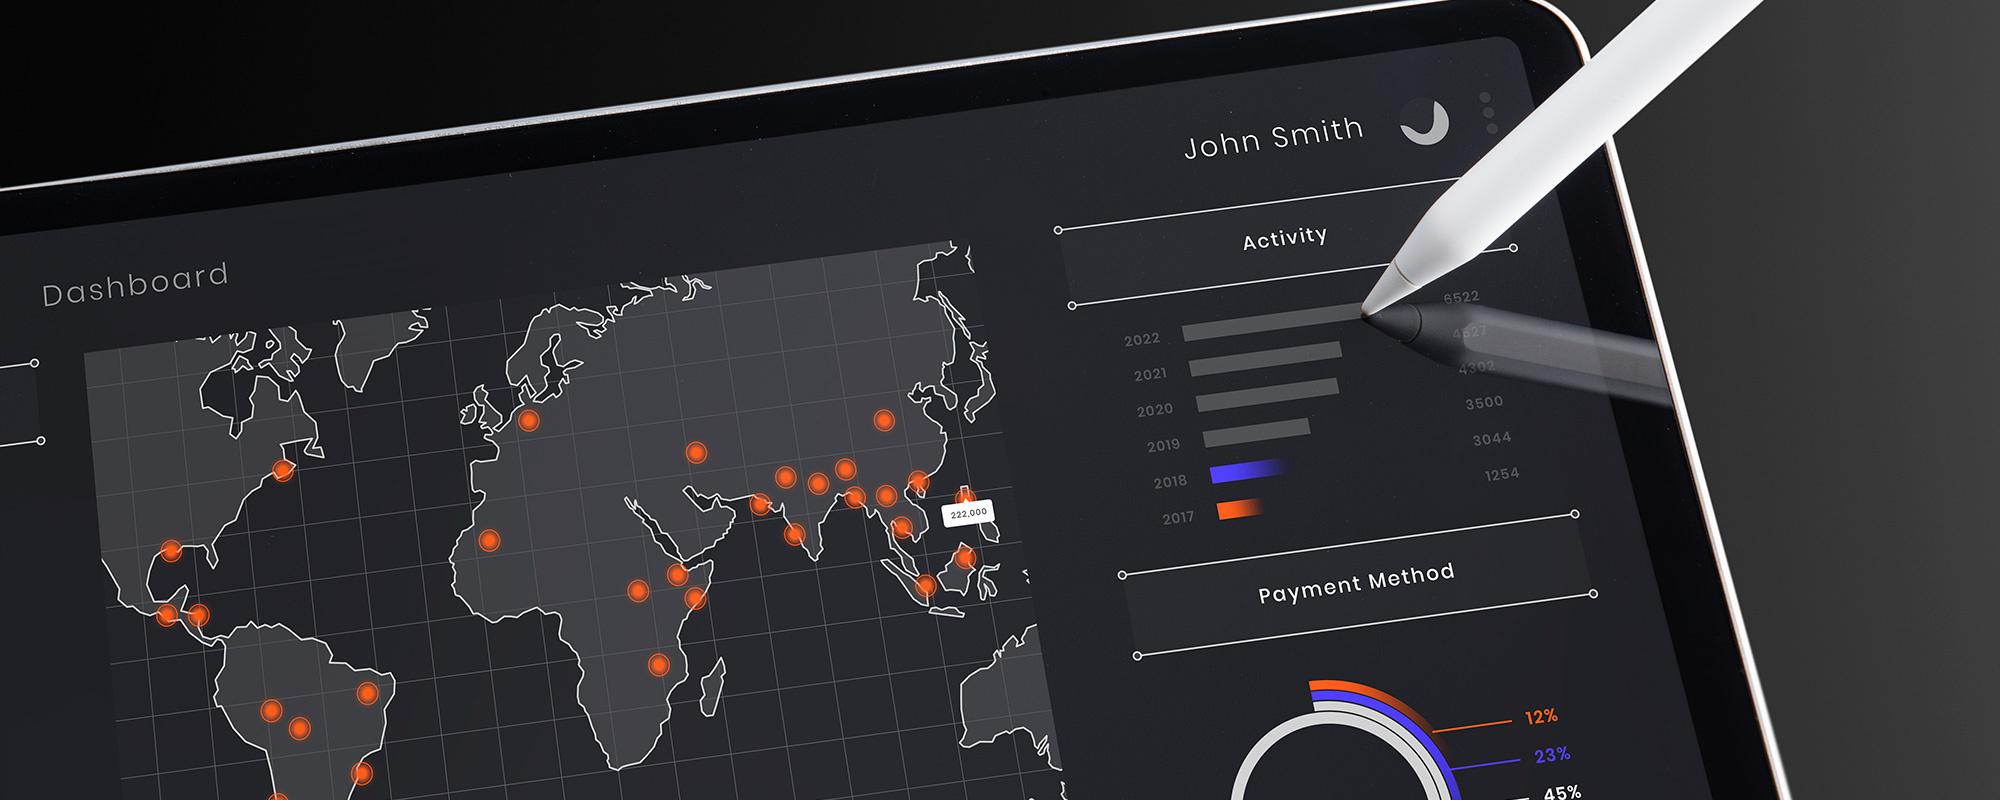
Advanced Data Visualization
We utilize advanced data visualization techniques to present your data in an easily understandable format. Our dashboards feature a variety of graphs and charts, making it simple to interpret complex data and identify trends at a glance.


Business Forecasting
Leverage historical data to forecast future business trends. Our dashboards are equipped with predictive analytics capabilities, allowing you to anticipate market changes and make proactive decisions. By analyzing cost and seasonal factors, we can forecast labor requirements and raw material needs for your products and services.
Real-Time Data Updates
Stay up-to-date with real-time data updates. Our dashboards continuously pull data from integrated sources, ensuring you always have the latest information at your fingertips.


User-Friendly Interface
Our dashboards are designed with the user in mind. The intuitive interface allows for easy navigation and customization, so you can focus on what matters most—your business.
Custom Reports and Access Levels
Create custom reports tailored to your needs and download them in various formats for presentations and meetings. Our dashboards also support different access levels, allowing each user to access data according to their role.